Zeuss Trading Stock Scanner & Portfolio Signal Engine
Stock Scanner • Portfolio Tracker • RSI Alerts

Know which stocks deserve your attention today — without spending hours searching.

A Windows stock scanner that tracks your watchlist, calculates Buy Zones, shows RSI signals, opens candlestick charts and imports your eToro / Trading 212 / IBKR / Interactive Brokers portfolio.

Buy Zones for possible entries RSI oversold/overbought alerts Portfolio actions & alerts
Scanner Results
Windows App
Ticker Signal RSI Buy Small Action
NVDA NEAR BUY 34.2 216.88 Hold / prepare add
AVGO WATCH 41.8 415.00 Wait for entry
PYPL TURNAROUND 38.5 62.40 Watch
RGTI HIGH RISK 52.1 22.99 Small only

No more manually checking 30+ stocks every day.

The scanner gives you a clear daily view: what to watch, where the buy zones are, and which alerts matter.

📊

Stock Scanner with Buy Zones

Automatically calculates Buy Small, Buy Good and Buy Strong zones using price, MA50, MA200, 52-week range and Fibonacci levels.

Daily Signals & Alerts

See BUY, BUY SMALL, NEAR BUY SMALL, WATCH/HIGH SCORE, AVOID and portfolio action alerts.

📈

Candlestick Charts with RSI

Double-click any stock to open a chart with candles, MA20, MA50, MA200 and an RSI panel.

🔔

Windows & Email Notifications

Get alerts when a new important signal, RSI setup or portfolio warning appears.

🧠

Editable Logic

Adjust the Buy Zone logic directly from the UI with plus/minus controls — no coding needed.

🧩

Clean Custom UI

Sidebar layout, hide/show columns, movable columns and a clean scanner table.

Example: why the Signal Engine gives a Buy Signal.

Zeuss Trading does not show a random BUY label. It combines valuation, momentum and technical levels into one practical scanner output.

Sample Scanner Output

Example Only
TickerNVDA
CategoryQuality / Growth
P/E18.5 — reasonable valuation (lower P/E can mean the stock is not too expensive vs its earnings)
RSI 1431.8 — near oversold (the stock may be under pressure and close to a possible bounce zone)
MA100Price just touched support area (many traders watch this moving average as a possible reaction level)
Buy ZoneCurrent price is near Buy Small (the first calculated entry area, usually for a smaller position)
SignalBUY SMALL — not a full position, just a cautious first entry idea

The signal appears when multiple factors align.

Instead of manually checking valuation, RSI, moving averages and support zones, the scanner brings the logic together and explains why a stock may deserve attention.

  • Reasonable P/E compared with the stock’s profile and category — a lower or fair P/E can suggest the price is not stretched versus earnings
  • RSI is close to oversold — this can mean selling pressure may be getting tired, although it is not a guaranteed reversal
  • Price pulls back into a moving-average support area like MA100 — a level many traders use to watch for possible bounces
  • The stock is close to the calculated Buy Small zone — the scanner’s first cautious entry area
  • Risk level remains acceptable for the selected category — speculative stocks need stricter rules than quality stocks

This is a fictional example for product demonstration only. It is not financial advice and does not recommend buying any specific stock.

See exactly what the tool gives you.

Real screenshots from Zeuss Trading Scanner: daily signals, editable buy zone logic and candlestick charts with RSI.
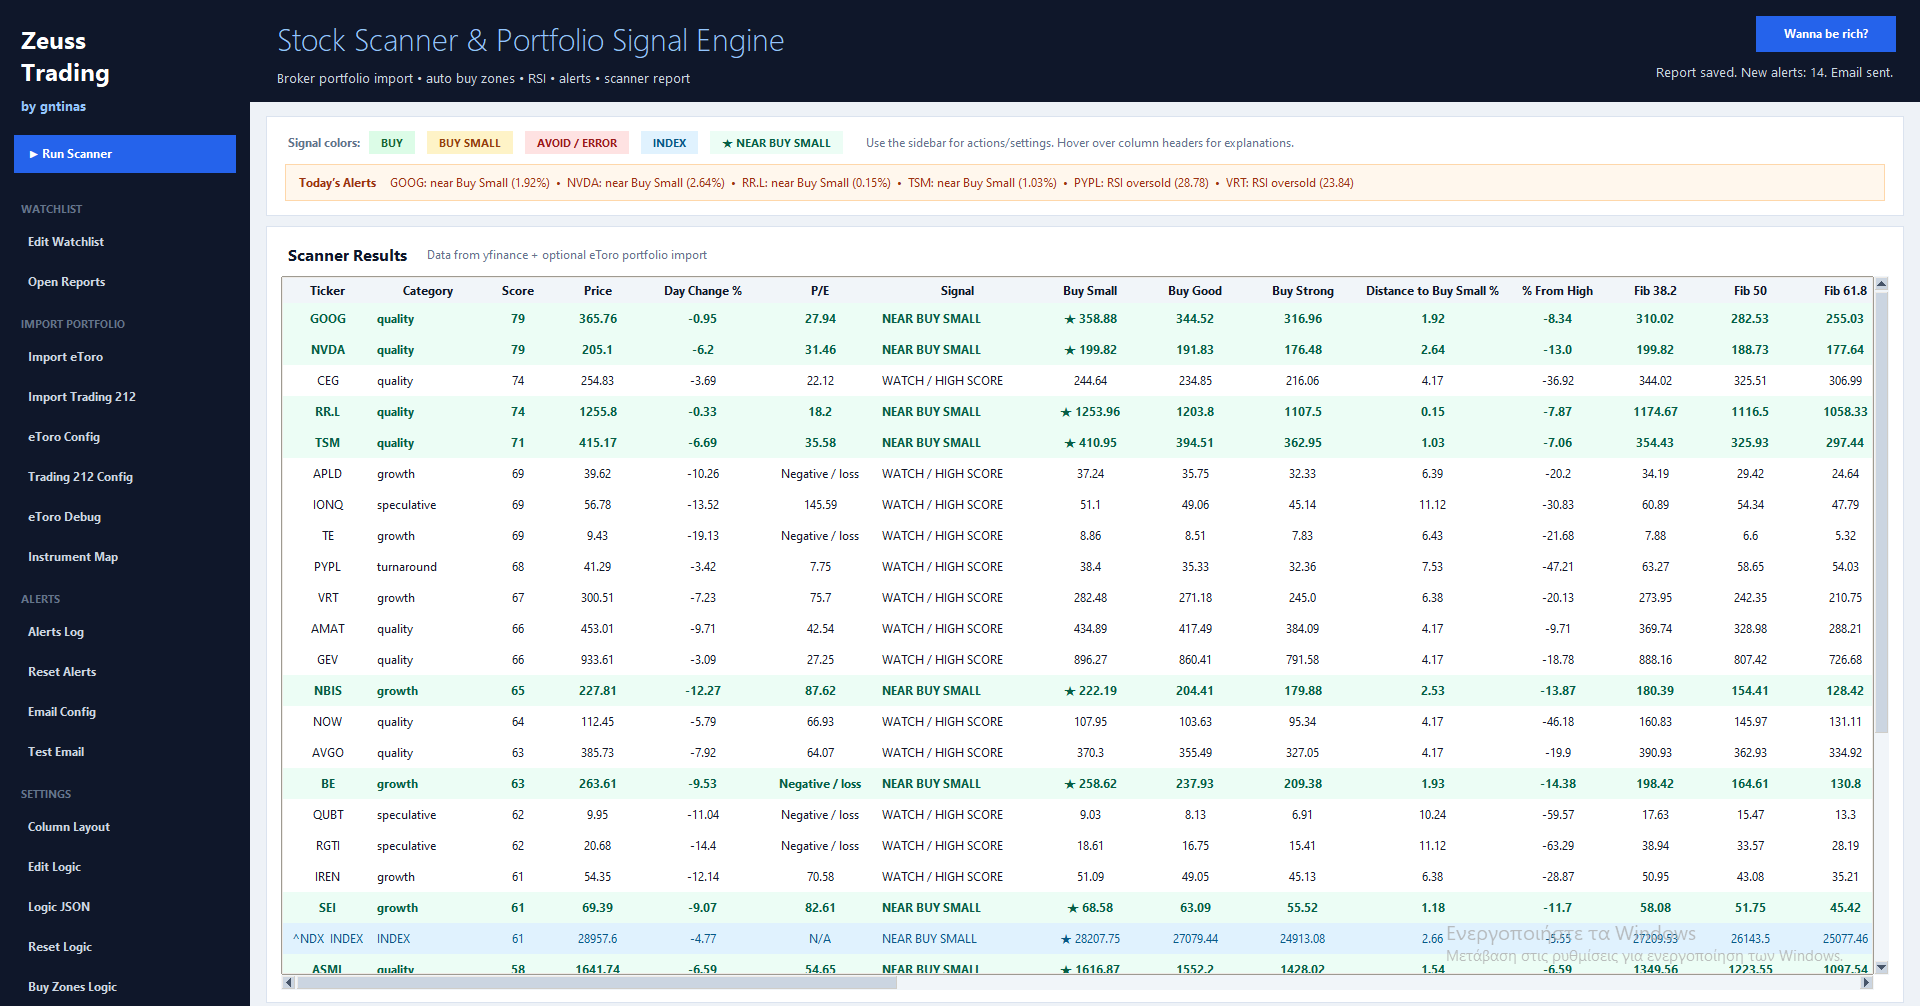
Zeuss Trading Scanner dashboard with stock signals, buy zones and alerts Click image to zoom
Daily Scanner Dashboard

One table that tells you what deserves attention today.

The main dashboard ranks your watchlist and highlights the most important setups. You can see the ticker, category, score, current price, daily change, P/E, signal, buy zones, distance to Buy Small, Fibonacci levels and today’s alerts in one clean view.

  • Daily BUY / NEAR BUY / WATCH signals
  • Buy Small, Buy Good and Buy Strong zones
  • Today’s alerts for fast decision-making
  • Sortable stock watchlist with custom columns
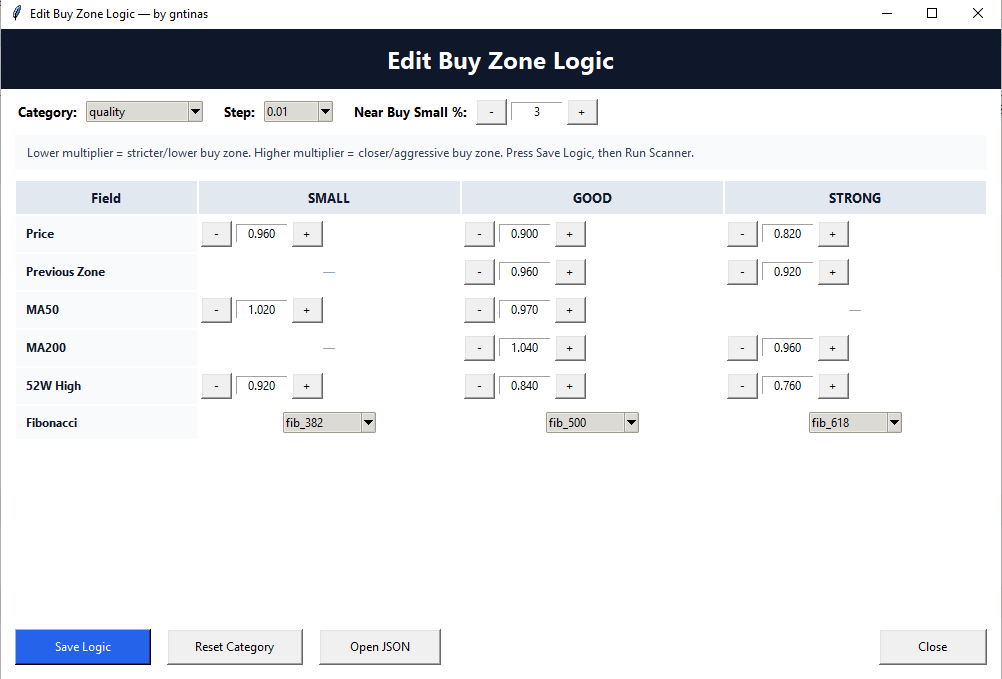
Editable buy zone logic editor with multipliers for price, MA50, MA200, 52 week high and Fibonacci Click image to zoom
Editable Buy Zone Logic

Adjust the scanner logic without touching code.

The Buy Zone Logic editor lets you fine-tune how aggressive or conservative the scanner is for each stock category. You can change the multipliers for price, previous zone, MA50, MA200, 52-week high and Fibonacci levels directly from the UI.

  • Separate logic by category: quality, growth, speculative and more
  • Plus/minus controls for fast multiplier changes
  • Near Buy Small threshold control
  • Save, reset or open the JSON config when needed
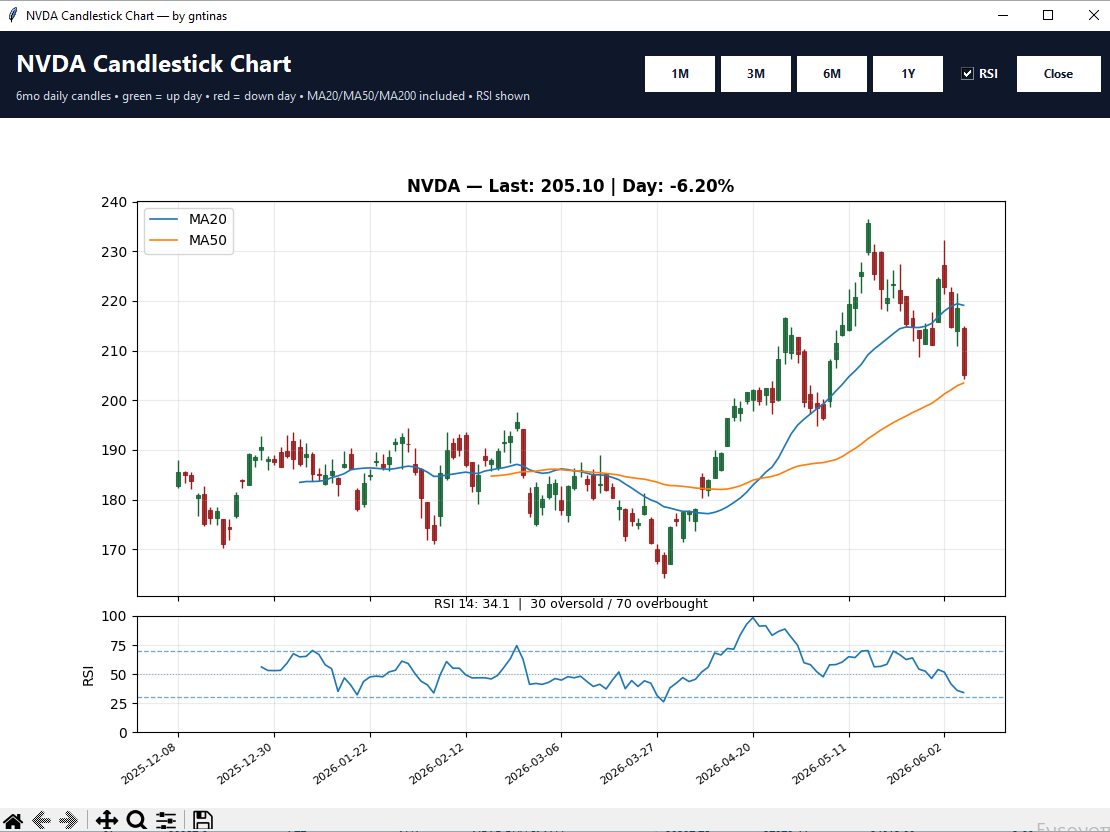
Candlestick stock chart with MA20 MA50 MA200 and RSI indicator Click image to zoom
Candlestick Charts + RSI

Double-click a stock and instantly inspect the chart.

Each stock can open in a dedicated candlestick chart window with moving averages and RSI. This helps you verify whether the signal makes sense visually before making a decision.

  • 1M, 3M, 6M and 1Y chart views
  • MA20, MA50 and MA200 trend lines
  • RSI panel with 30/70 reference levels
  • Quick visual confirmation of buy zones and momentum

See exactly how Zeuss Trading Scanner finds stock signals in under 2 minutes.

Watch how the scanner turns your watchlist into daily Buy, Watch and Avoid signals with Buy Zones, RSI, moving averages and valuation data.

2-minute product walkthrough See the real workflow before buying: run the scanner, read the signals, open the candlestick chart and understand how P/E, RSI and Buy Zones work together. Subtitles are included. Use the CC button if they do not appear automatically.
Get the Scanner for €49

No subscription. One-time payment. Windows app with setup guide.

Daily Scanner Watchlist, signals, P/E, RSI and Buy Zones in one table.
Candlestick Chart MA20, MA50, MA200, RSI and valuation box.
Portfolio Workflow Designed for faster daily review and cleaner decision support.

Portfolio API connectors built for active investors.

Import broker positions and let Zeuss Trading Scanner turn them into practical portfolio action signals.

eToro

Import your eToro positions and review holdings, PnL, Buy Zones and Portfolio Action labels in one dashboard.

Trading 212

Connect Trading 212 positions and see which stocks are near entry zones, which need patience and which may need profit protection.

Interactive Brokers / IBKR

Import IBKR positions through the local Client Portal Gateway and combine them with RSI, Buy Zones and daily scanner alerts.

API imports are used for read-only portfolio analysis. The scanner focuses on signals, alerts and decision support — not automatic trading.

Portfolio action signals for your eToro, Trading 212 or Interactive Brokers positions.

Import your broker portfolio and the scanner helps you understand what to do next with each position — not just where the stock price is.

From portfolio data to daily actions.

Zeuss Trading combines your current positions with price action, RSI, moving averages, Fibonacci levels and Buy Zones to produce practical action labels.

  • Hold WinnerKeep strong positions running
  • Watch EntryGood setup, wait for better price
  • Prepare AddNear Buy Small zone
  • Trim / Protect ProfitPosition has strong gains or risk
  • Take Profit AlertProfit or 52-week high warning
  • Avoid / WaitPrice or risk is not attractive yet
eToro Import

See signals on your existing eToro holdings.

Import your eToro positions and view portfolio units, invested amount, PnL, PnL %, Buy Zones and Portfolio Action in the same scanner table.

Trading 212 Import

Turn your Trading 212 portfolio into an action dashboard.

Pull your open positions from Trading 212 and let the scanner show which stocks are near an add zone, which need patience and which may need profit protection.

Interactive Brokers Import

Connect IBKR positions to your signal workflow.

Import open positions from Interactive Brokers / IBKR through the local Client Portal Gateway and review them with Buy Zones, RSI alerts and Portfolio Action labels.

Daily Routine

Run it once per day and focus only on what changed.

Instead of checking every chart manually, you get a clear list of alerts and actions based on your watchlist and your real portfolio.

Run it automatically and receive email alerts without checking manually.

After one-time setup, Zeuss Trading Scanner can be scheduled on Windows to run daily, scan your watchlist and email you the most important alerts.

Your daily scanner routine can run in the background.

Instead of opening charts one by one, you can schedule the app with Windows Task Scheduler. The scanner runs, checks your stocks, creates the report and sends email alerts when something important appears.

1
Schedule the scanner Set it to run every morning or whenever you prefer using Windows Task Scheduler.
2
Scan watchlist and imported portfolio It checks Buy Zones, RSI, moving averages, Fibonacci levels and portfolio action signals.
3
Receive email alerts Get notified only when there are useful alerts like Near Buy Small, RSI oversold or Take Profit warnings.

What users say about Zeuss Trading Scanner.

Designed for investors who want a faster, cleaner and more structured way to review their watchlist and portfolio.

★★★★★

“The biggest value is that I do not need to open every chart manually. I run the scanner, check the alerts and instantly know which stocks deserve attention.”

M
Michael R. Swing trader
★★★★★

“The Buy Zones and RSI alerts make the process much more disciplined. I like that it explains whether a stock is a watch, near buy or portfolio action.”

A
Alex P. Portfolio investor
★★★★★

“The email alerts are exactly what I needed. I can let the scanner run and only check the market when something important appears.”

D
David K. Part-time investor
★★★★★

“The candlestick chart with RSI and P/E in the same view makes it easier to confirm if a signal is actually worth checking.”

S
Sarah L. Active investor
★★★★★

“I use it before the market opens to organize my watchlist. The Near Buy and Watch labels save me a lot of time.”

J
James T. Watchlist trader
★★★★★

“It gives me a structured routine instead of random chart checking. The buy zones and portfolio actions are the most useful parts.”

N
Nathan B. Long-term investor

Get the Daily Stock Signal Engine

One Windows app for daily stock scanning, portfolio alerts and technical analysis.

Launch Offer

Daily Stock Signal Engine by Zeuss

€49 / one-time

Windows desktop app + setup guide.

  • Stock Scanner with Buy Zones
  • RSI Signals & Candlestick Charts
  • eToro / Trading 212 / IBKR / Interactive Brokers portfolio import
  • Windows & Email alerts
  • Editable logic and custom columns
  • Excel reports

After payment: we will send the Signal Engine Software and setup guide to your PayPal email address.

Secure checkout powered by PayPal.

Frequently Asked Questions

Everything you need to know before buying.

Is this financial advice?

No. This is a scanner and analysis tool. Signals are for research and decision support only. Always verify the data before investing.

Does it run on Windows?

Yes. It is a Windows desktop app. Setup instructions and requirements are included.

Can I edit the Buy Zones?

Yes. The app includes a Logic Editor where you can adjust Buy Zone multipliers and RSI levels.

Does it connect to brokers?

It supports portfolio import from eToro, Trading 212 and Interactive Brokers / IBKR, if you have the required API credentials and the required broker setup.

Where does it get stock prices from?

The scanner uses yfinance for market data and creates Excel reports after each scan.

How does Interactive Brokers / IBKR import work?

IBKR import is designed for read-only portfolio analysis through the local IBKR Client Portal Gateway. After setup, the scanner can import open positions and show Buy Zones, RSI alerts and Portfolio Action signals.

Want more information before buying?

Send us an email and we will help you understand how Zeuss Trading Scanner works, how portfolio import is configured and whether it fits your trading routine.

info@zeuss-trading.com

Stop checking stocks manually. Run the scanner and know what deserves attention.

Buy Zones, RSI alerts, candlestick charts and portfolio actions in one clean Windows app.

Get the Daily Stock Scanner
Disclaimer: This tool is a scanner and analysis tool. It is not financial advice. Markets involve risk and every investment decision is your own responsibility.